PART3AC Circuit
Experiment 4 :LC Resonance Circuit
Theory
In the circuit composed of R-L-C, if AC voltage is added and the phase of voltage and current becomes inphase, it is called Resonance and the frequency here is called Resonance Frequency. When in resonance, the reactances counterbalance each other so only the pure resistance remains at the impedance. Therefore, if you calculate the combined impedance of certain circuit and if its part of imaginary number is “0”, it is the condition of resonance. Also, the reactance becomes “0” in case of resonance so the reactive power cannot exist and only the effective power consumed at the pure resistance exists, so the power factor is “1”.
R-L-C Series Resonance Circuit
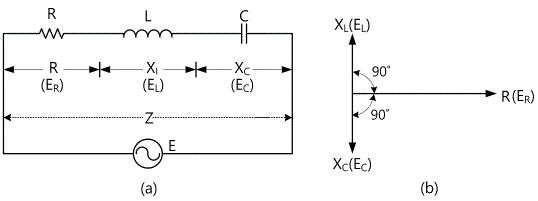
As in Fig. 3-14 (a), if R, L, C elements are connected in series, their AC combined resistance, that is, the impedance Z and the size of Z and the phase become as below.
Impedance
Size 
Phase 
In L-C series circuit, at the frequency of ω0L=1/(ω0Ç), the Z of the circuit has the pure resistance only and the frequency here becomes resonance frequency. The angular frequency satisfying this condition is ω0=1/√LC, and this ω0 is called Resonance Angular Frequency and the resonance angular frequency f0 is expressed as below.

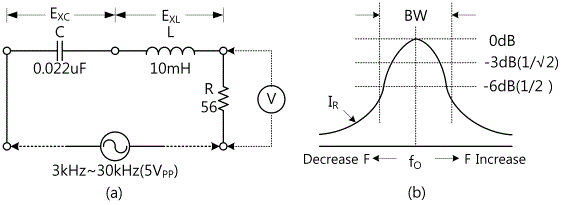
The relationship between the resonance frequency and the current is as in Fig. 3-14(b). If the current flowing under the resonance frequency f0 is "1" and the frequencies that become ±(1/√2) are called f1,f2 Q(quality factor), which indicates the sharpness of the curve, can be defined as below.

The bigger Q is, the narrower the bandwidth is, and the smaller Q is, the wider the bandwidth is.
R-L-C Parallel Resonance Circuit
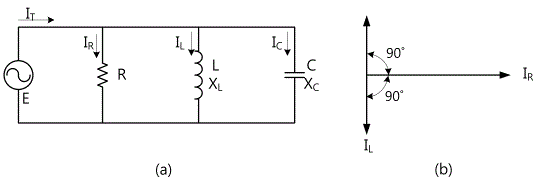
As in Fig. 3-15 (a), if R, L, C elements are connected in parallel, their AC combined resistance, that is, the impedance Z and the size of Z and the phase become as below.
Impedance 
Size 
Phase 
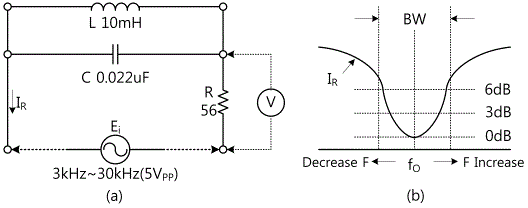
In L-C parallel circuit, at the frequency of ω0 C=1/ω0 L, the Z of the circuit has the pure resistance only and the frequency here becomes resonance frequency. The angular frequency satisfying this condition is ω0=1/√L C, and this ω0 is called Resonance Angular Frequency and the resonance angular frequency f0 is f0=1/(2π√(LC)). The Q(quality factor) in the parallel resonance circuit , as in the series resonance circuit, is defined as Q=f0/(f2-f1) and expressed as Q=ω0 CR=R1/(ω0 L). That is, Q is in proportion to R. Pig. 3-15(b) shows the relationship graph between the resonance frequency and the current in the parallel resonance.
Experiment Process
R-L-C Series Circuit
tab1Experiment 3-4.1 RLC Series Resonance Circuit (Compose as in Fig. 3-16 (a))
1.Connection
1.Circuit Connection
Function Generator Connection
Connect between A+ terminal of Signal Output on the front panel and 4h terminal of Circuit-4 with red line, and between A- terminal and 4i terminal of Circuit-4 with black line.
Oscilloscope and Voltmeter Connection
Connect between A+ terminal of Signal Output CH A on the front panel and 4d terminal of Circuit-4 with red line, and between A- terminal and 4f terminal of Circuit-4 with black line.
Connect between B+ terminal of Signal Output CH B on the front panel and 4a terminal of Circuit-4 with red line, and between B- terminal and 4c terminal of Circuit-4 with black line.
2.Wiring Diagram
3.Measurement
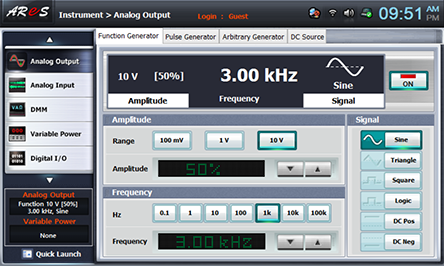
- 1Choose analog ouput at the left menu of front panel.
In Function Generator window, choose Amplitude as and click to set up the amplitude as 50% amplitude 50%.
Choose Frequency as and click to set up as 3kHz frequecy3.0khz.
Choose Signal as and click to output 3KHz 5Vp-p.
- 2Choose analog input at the left menu of front panel.
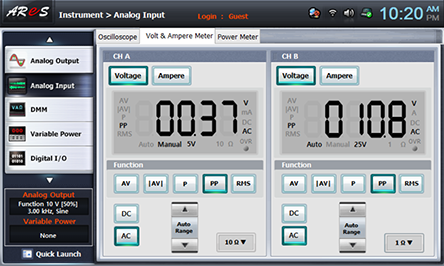
Choose Volt & Ampere Meter and choose , , at CH A and CH B each, then the measured value is indicated. Record it in the Relevant Frequency column of table 3-5. Ch A is ER, and CH B is EX.
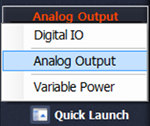
- 3Choose quick launch at the left menu of front panel and click analog output
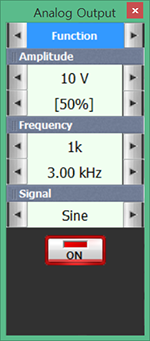
Frequency 3.00kHz 우측에 을 클릭하여 주파수를 1kHz 증가시키고, 전면 패널 좌측 메뉴에서 analog input 을 선택하여 Volt & Ampere Meter의 CH A와 CH B에서 표시된 측정값을 표 3-5의 해당 주파수 란에 기록한다. (CH A는 ER, CH B는 Ex)
주파수를 20KHz 까지 변화시키면서 측정 기록한다.
4.Calculation
1. The highest point on the graph is 0dB, so calculate the voltages at the points of -3dB, -6dB and indicate them on X axis. Then record the frequencies of Y axis on those points in table 3-6. Record the bandwidth.
R-L-C Parallel Circuit
Experiment 3-4.2 RLC Parallel Resonance Circuit (Compose as in Fig. 3-17 (a))
1.Connection
1.Circuit Connection
Connect between 4k terminal and 4n terminal of Circuit-4 with yellow line.
Function Generator Connection
Connect between A+ terminal of Signal Output on the front panel and 4q terminal of Circuit-4 with red line, and between A- terminal and 4r terminal of Circuit-4 with black line.
Oscilloscope and Voltmeter Connection
Connect between A+ terminal of Signal Output CH A on the front panel and 4p terminal of Circuit-4 with red line, and between A- terminal and 4n terminal of Circuit-4 with black line.
Connect between B+ terminal of Signal Output CH B on the front panel and 4j terminal of Circuit-4 with red line, and between B- terminal and 4k terminal of Circuit-4 with black line.
2.Wiring Diagram
3.Measurement
- 1Execute the process of Experiment 3-4.1 Measurement and record the result in table 3-7.(CH A is ER 2, CH B is Ex)
- 2Draw the measured result of ER2 of table 3-7 in the graph below.
- 3Connect between 4n terminal and 4o terminal of Circuit-4 with yellow line and execute 1). Here, CH A is the measured value when R2 and R3 are in parallel connection.
4.Calculation
1. The lowest point on the graph is 0dB so calculate the voltages at the points of +3dB, +6dB and indicate them on the X axis. Record the frequencies of Y axis on those points in table 3-8. Record the bandwidth
Experiment Result Report
1. Experiment Result Table
1) Draw the ER measured value of table 3-5 on the graph below
2. Review and Explanation
1) Calculate resonance frequency in the circuit of Fig. 3-16(a) and compare it with the resonance frequency in the graph above.
2) Explain the reason why the resonance current becomes maximum in R-L-C series resonance circuit.
3) When permitting the effective voltage [V] to the R_L-C series circuit of [Ω], [mH] , [㎌],calculate the resonance frequency, current and voltage for each terminal on the element R, L, C.
3. Discuss the Experiment Result.
Experiment Result Report
1. Experiment Result Table
1) Draw the ER measured value of table 3-7 on the graph below.


