


PART12Pulse Circuit
Experiment 4 :Monostable Multivibrator Circuit
Theory
Monostable Multivabrator is used when the pulse should be delayed or the switch should be open and closed for certain period of time. Monostable multivabrator is same as composing one combined circuit of non-stable multivabrator by resistance division, as in fig.12-15.
In normal state, Tr2 is ON because the base current flows by Rk1, and Tr1 is OFF because the collector of Tr2 is 0V and (-) voltage is applied to the base by Rk2, RB. Ck2 is charged as much as the power voltage and if (-) trigger pulse turns on, the collector potential of Tr1 decreases and the voltage of Ck1 is applied in (-) direction to the base of Tr2 so Tr2 is OFF. As the collector voltage of Tr2 increases, the base current flows so Tr1 is ON and Tr2 is completely OFF. Then, the electric charge of Ck1 starts to be discharged through Rk1 and from the moment when the electric potential of Ck2 changes from (-) potential to VBE + VE, Tr2 is ON and Tr1 is OFF again to their normal state. The operation time T is from the discharge of Ck1 to turning ON of Tr2.
The formula of electric charge that discharges Ck1, Rk1 is as below.
From the formula above, calculate the base voltage of Tr2 when the initial condition is t=0, VCk1 = -VCC.
If the time till it becomes VB(Tr2) = VBE + VE ≅ 0V is calculated, the operation time is T=0.69Rk1∙Ck1.
Experiment Process
1. Using Circuit-4 of M-12, compose a circuit as in fig.12-16. And apply the pulse signal of 100Hz and 1000Hz to both ends of 4c-4d terminals.
2. Measure output frequency, input pulse period, and output pulse period and record the result in table 12-6.
3. Measure and record the pulse width of output by changing R3 value given in table 12-7 and record the calculated value in the relevant column.
tab1
Experiment 12-4.1
Monostable Multivibrator Circuit Experiment
(In Circuit-4 of M12, compose a circuit as in fig.12-16.)
1.Connection
1.Power connection is internally connected.
2.Measuring Instrument Connection
Function Generator Connection
Plug in BNC cable to BNC terminal of Signal Output on front panel and connect red line to 4a terminal of Circuit-4, and black line to 4b terminal.
Oscilloscope and Voltmeter Connection
Input Voltage Measurement Connection: Connect between 4a terminal of Circuit-4 and A+ terminal of Signal Input CH A on the front panel of Multimeter with red line, and between 4b terminal and A- terminal with black line.
Output Voltage Measurement Connection: Connect between 4h terminal of Circuit-4 and B+ terminal of Signal Input CH B on the front panel of Multimeter with red line, and between 4i terminal and B- terminal with black line.
2.Wiring Diagram
flash
3.Measurement
- 1Circuit-4 of M12, compose a circuit as in fig.12-16. Here, R3 is all located at High.
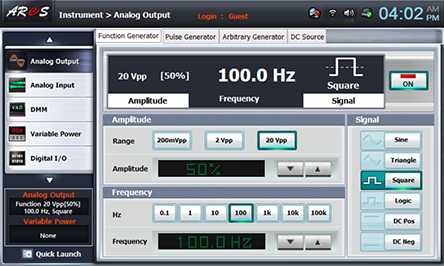
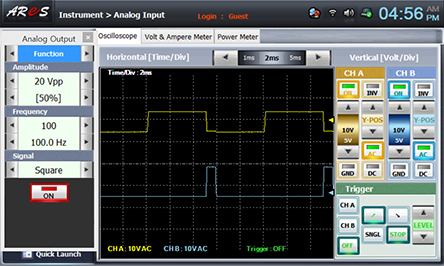
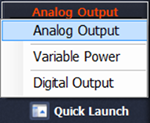
- 2Choose analog output at Touch LCD panel, set up Amplitude Range as , and Amplitude as amplitude 50%. Choose at Frequency to make 100hz. Set up Signal as , and click to send the output to Circuit-4.
- 3Choose analog input at front panel and draw the wave form in oscilloscope screen in the relevant column of table 12-6.
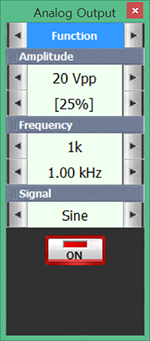
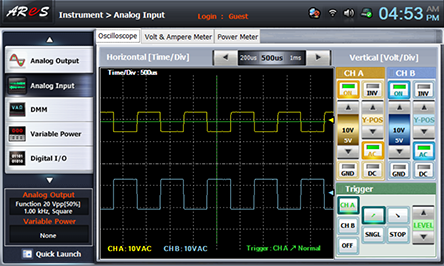
- 4Choose quick launch on the left bottom of the screen, click Analog Output and click of Frequency 100 to output 1kHz. Record the indicated input/output wave form in the relevant column of table 12-6.
- 5Measure and record the pulse width of output by changing the R3 value given in table 12-7 and record the calculated value in the relevant column.
Choose analog input at front panel by setting up R3 as in table 12-7, draw the wave form in oscilloscope screen in the relevant column of table 12-7, and record and calculate the pulse width.
result_table R3
[㏀]1 2 4 8 15 1㏀ 2㏀ 4㏀ 8㏀ 15㏀ sw SW4 SW3 SW2 SW1 SW4 SW3 SW2 SW1 SW4 SW3 SW2 SW1 SW4 SW3 SW2 SW1 SW4 SW3 SW2 SW1 L L L H L L H L L H L L H L L L H H H H 1kΩ :

2kΩ :

4kΩ :

8kΩ :
15kΩ :

- 6Change the input of function generator from 4a-4b terminal of Input-1 to 4c-4d terminal of Input-2 and measure the pulse width of output by changing the R3 value given in table 12-7. Calculate and record the result.
Wiring Diagram
flash
- 7the measurement, click at quick launch screen and cut off the output.