


PART11Oscillation Circuit
Experiment 2 :Wien Bridge Oscillator
Theory
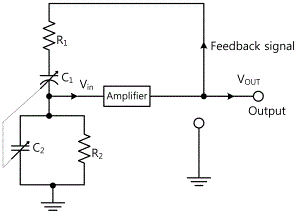
When frequency oscillation of wide range and low distortion level are required, Wien bridge oscillator in fig.11-4 is used. This circuit is used for the sine wave generation in the lab and normally has 5Hz~500kHz frequency range. In fig.11-3, two capacitors are used to change the frequency. Here, the resistance and the capacitor have same values, and the dotted line between C1 and C2 means the variable capacitor C1 and C2 are interlocked with each other (That is, C1 and C2 are mechanically connected so that the two can be controlled at the same time with one regulator handle.). Also, operational amplifier is usually used to earn necessary gain.
The basic operation of this circuit is done by the fact that the frequency with which the phase shift of feedback signal becomes 0 is only one, and this phenomenon occurs at the frequency which feedbacks with the biggest amplitude to the input of amplifier. To the very low frequency that feedbacks to series R1-C1 circuit, C1 becomes the open circuit so Vin becomes very small. As the feedback signal frequency increases, Vin gradually increases and if the shunt capacitor C2 becomes short circuit, Vin has the peak value, which occurs at the frequency where Vout execute 0 phase shift with Vin. Therefore, if the amplifier is non-inverted as CE concatenation of 2 terminals or operational amplifier, Barkhausen condition is satisfied with single frequency so stable oscillation can be earned.
When R and C of series/parallel RC circuit have same values, the maximum feedback signal and 0 phase shift frequency (oscillation frequency) can be expressed as below.
Experiment Process
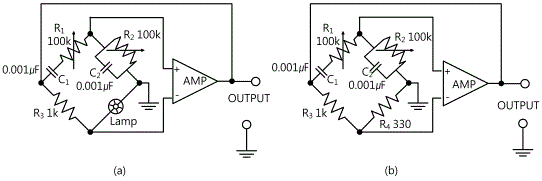
1. In Circuit-2 of M-11, make R1 and R2 as maximum(100kΩ), and connect the lamp(connect between 2g-2f) to compose the circuit of fig.11-5(a).
2. Measure the minimum and maximum frequency of output terminal by changing R1 and R2 and record the result in table 11-2. Record distortionless output frequency and distortionless output voltage(rms) at the relevant columns, and calculate and record the minimum frequency.
3. In Circuit-2 of M11, connect R4 instead of lamp(connect between 2d-2c) and compose a circuit as in fig.11-5(b), repeat process 2 and record the measured value and minimum frequency in the relevant column of table 11-2.
tab1Experiment 11-2.1 Wien Bridge Oscillator Experiment (In Circuit-2 of M11, compose circuits as in fig.11-5(a), (b).)
1.Connection(Experiment of Fig.11-5(a) circuit in Circuit-2 of M11)
1.Circuit Connection
To connect Lamp L1 to the circuit, connect between 2g terminal of Circuit-2 and 2f terminal with yellow line.
2.The power connection is internally connected.
3.Measuring Instrument Connection
Oscilloscope and Voltmeter Connection
Output Voltage Measurement Connection: Connect between 2k terminal of Circuit-2 and A+ terminal of Signal Input CH A on the front panel of Multimeter with red line, and between 2l terminal and A- terminal with black line.
2.Wiring Diagram
flash
3.Measurement
- 1Make R1 and R2 as maximum(100㏀), connect the lamp(connect between 2g-2f) and compose the circuit of fig.11-5(a).
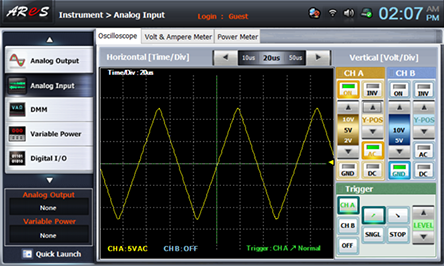
Choose analog input at front panel, change R1 and R2 by referring to the wave form of Oscilloscope screen and measure and draw the minimum and maximum frequency wave form in table 11-2, and calculate and record the frequency.
Minimum Frequency :
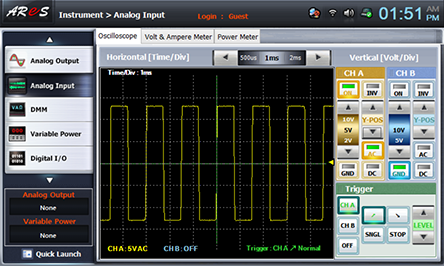
Maximum Frequency :
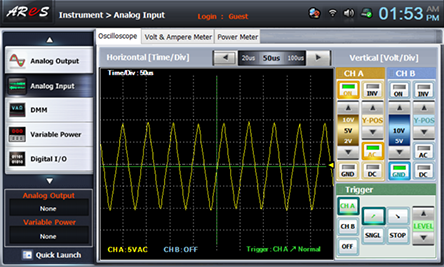
Change R1 and R2 without distortion, draw the output wave form(distortionless output) and calculate and record the output frequency in the relevant column of table 11-2.
Distortionless Output Wave Form:
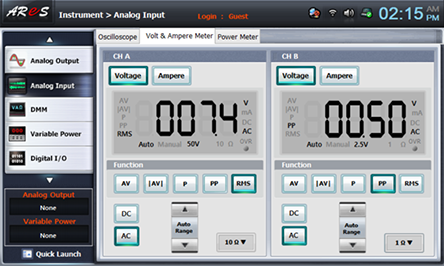
Choose Volt & Ampere Meter tab, click , , at CH A and record the indicated output voltage in the relevant column of table 11-2.
- 2In Circuit-2 of M11, change the circuit connection to do the experiment for circuit of fig.11-5(b).
In 1. Connection>1) Circuit Connection, change the yellow connection line for Lamp L1 between 2g terminal and 2f terminal to between 2c terminal and 2d terminal for R4 connection.
Wiring Diagram
flash
Execute 3. Measurement>1) process and record the result in the relevant column of table 11-2.